
Lesson 1: ความผันแปรและแผนภูมิควบคุม (Variation and Control charts)
One of the most important names in the history of statistical process control is Deming as explained above. Deming used a famous simulation to explain the principles of variation called: The red bead experiment. While explaining the principles of variation we like to honor Deming by using his red bead box. In this lesson we are going to explain the principles of variation and how we will analyze variation using control charts.
ชื่อบุคคลสำคัญที่สุดในประวัติศาสตร์ของการควบคุมกระบวนการทางสถิติคือ Deming ตามที่อธิบายไว้ที่บทนำ Deming ใช้แบบจำลองที่มีชื่อเสียงเพื่ออธิบายหลักการพื้นฐานของความผันแปร(Variation)ที่เรียกว่า การทดลองลูกปัดสีแดง(Red bead experiment) ในขณะที่อธิบายหลักการของความผันแปรเราชอบที่จะให้เกียรติ Deming โดยใช้กล่องลูกปัดสีแดงของเขา ในบทเรียนนี้เราจะอธิบายหลักการของความผันแปรและวิธีที่เราจะวิเคราะห์ความผันแปรโดยใช้แผนภูมิควบคุม
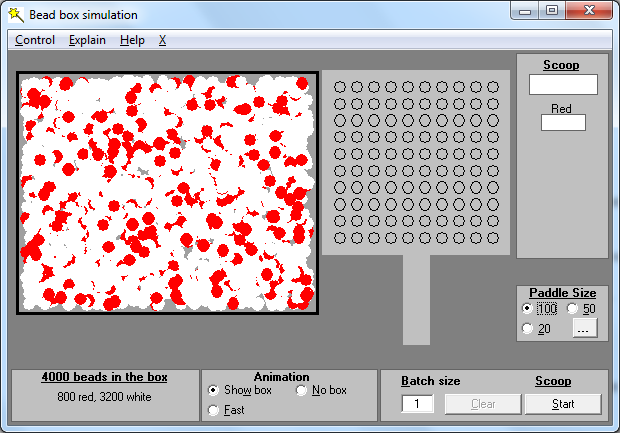
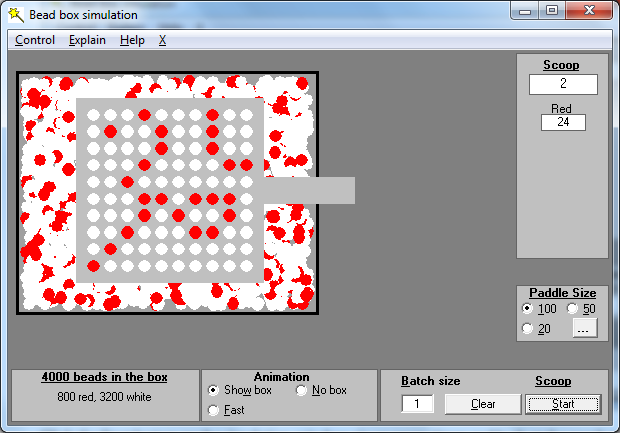
Imagine that you are interested in a process and you want to get better results from that process. It may be a manufacturing process or a service process, it may be in the public sector or you may work for a private company. We are going to count a particular type of thing which you would prefer did not happen. We will scoop beads from a box to simulate the process and any red beads scooped are going to represent the thing you would prefer to avoid.
ลองนึกภาพว่าคุณสนใจกระบวนการและต้องการได้ผลลัพธ์ที่ดีขึ้นจากกระบวนการนั้น อาจเป็นกระบวนการผลิตหรือกระบวนการให้บริการ อาจเป็นในภาครัฐหรือคุณอาจทำงานให้กับ บริษัทเอกชน เราจะนับจำนวนเฉพาะสิ่งที่คุณต้องการไม่ให้เกิดขึ้น เราจะตักลูกปัดจากกล่องเพื่อจำลองกระบวนการและลูกปัดสีแดงใด ๆ ที่ตักออกมาจะเป็นตัวแทนของสิ่งที่คุณต้องการหลีกเลี่ยง
We can take a number of scoops from the box and we can count the number of red beads drawn with every scoop.
เราสามารถตักจากกล่องได้จำนวนหนึ่งและเราสามารถนับจำนวนเม็ดสีแดงที่ได้จากการตักทุกๆครั้ง
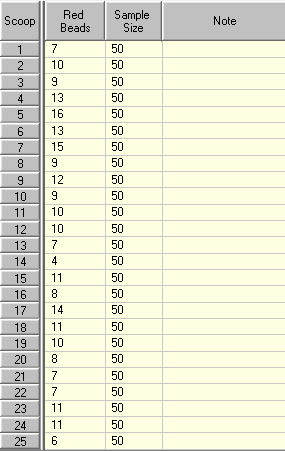
The point to understand here is that it is random variation which is producing the different number of red beads in each scoop. Every process contains some random variation and the people who operate the process have no control over it.
Let’s now look at a table of the results:
ประเด็นที่ต้องเข้าใจก็คือมันเป็นไปแบบสุ่มซึ่งทำให้เกิดจำนวนเม็ดสีแดงที่แตกต่างกันในแต่ละครั้ง ทุกกระบวนการมีความผันแปรแบบสุ่มและผู้ที่ดำเนินการกระบวนการไม่สามารถควบคุมได้
ตอนนี้เรามาดูตารางผลลัพธ์กัน:
Now, suppose that we did not know that these results were due to random variation. Say, for example, that the figures come from a school and represent the number of pupils expelled for bad behavior each year.
ตอนนี้สมมติว่าเราไม่ทราบว่าผลลัพธ์เหล่านี้เกิดจากความผันแปรแบบสุ่ม ยกตัวอย่างเช่น ตัวเลขมาจากโรงเรียนและแสดงถึงจำนวนนักเรียนที่ถูกไล่ออกจากโรงเรียนเนื่องจากพฤติกรรมที่ไม่ดีในแต่ละปี
Translate the numbers you find into headlines in your local newspaper:
แปลตัวเลขที่คุณพบเป็นหัวข้อข่าวในหนังสือพิมพ์ท้องถิ่นของคุณ:
“Big jump in expellings from school – officials want to know why”
การถูกไล่ออกจากโรงเรียนครั้งใหญ่ – เจ้าหน้าที่ต้องการทราบสาเหตุ
“The number of expelled pupils has fallen since the new headmaster took over.”
จำนวนนักเรียนที่ถูกไล่ออกได้ลดลงตั้งแต่อาจารย์ใหญ่คนใหม่เข้ามา
“Number of expelled pupils has increased for 3 years in a row. Experts blame video games.”
จำนวนนักเรียนที่ถูกไล่ออกเพิ่มขึ้นเป็นเวลา 3 ปีติดต่อกัน ผู้เชี่ยวชาญตำหนิวิดีโอเกม
It is very easy to fall into the trap of assuming that there is always a reason for figures going up or down. There is no reason – other than random variation – to explain why the number of red beads drawn by the paddle changes with every scoop. Every year, random variation alone will cause a different number of pupils to enter the school system with behavior problems.
มันง่ายมากที่จะตกหลุมพรางที่สมมติว่ามีเหตุผลที่ตัวเลขจะขึ้นหรือลงเสมอ ไม่มีเหตุผลใด ๆ – นอกเหนือจากความผันแปรแบบสุ่ม – เพื่ออธิบายว่าเหตุใดจำนวนเม็ดสีแดงที่ลากโดยไม้พายจึงเปลี่ยนไปในทุกครั้ง ทุกๆปี ความผันแปรแบบสุ่มเพียงอย่างเดียวจะอธิบายได้ว่าจำนวนนักเรียนที่เข้ามาเรียนที่แตกต่างกันเป็นสาเหตุจากปัญหาด้านพฤติกรรม
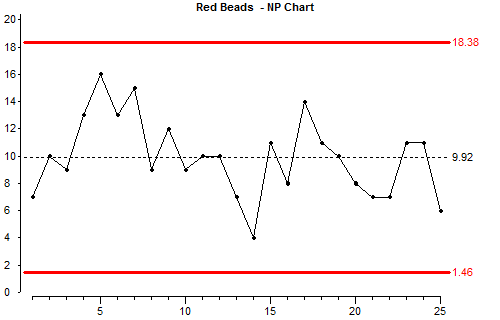
Let’s look how this information would look in a chart:
มาดูกันว่าข้อมูลนี้จะมีลักษณะอย่างไรในแผนภูมิ:
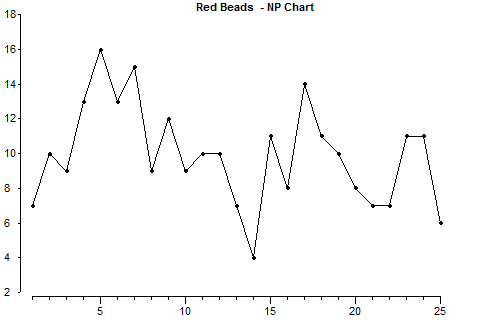
This is what random variation looks like. Putting past results in time sequence on a chart like this should make us less likely to jump to conclusions about an individual result. We might be less likely to assume that an upward or downward trend of just 3 or 4 results means that a long-term change is taking place.
However, we do need to know if a new policy, or a change in procedures, or a change to a process really affects the results. So we need something which points out the significant changes and encourages us to ignore the random variation. This is where control limits come in.
สิ่งนี้คือความผันแปรแบบสุ่ม การพล็อตผลลัพธ์ที่ผ่านตามลำดับเวลาบนแผนภูมิเช่นนี้จะ
นี่คือลักษณะของรูปแบบสุ่ม การพล็อตผลลัพธ์ที่ผ่านมาตามลำดับเวลาบนแผนภูมิเช่นนี้จะทำให้เรามีโอกาสน้อยที่จะข้ามไปสรุปเกี่ยวกับผลลัพธ์แต่ละตัว เราอาจคาดเดาได้เพียงเล็กน้อยว่าแนวโน้มขาขึ้นหรือขาลงจากผลลัพธ์เพียง 3 หรือ 4 ตัวที่เป็นตัวแทนอธิบายความหมายในระยะยาวกำลังเกิดขึ้น
อย่างไรก็ตามเราจำเป็นต้องทราบว่านโยบายใหม่หรือการเปลี่ยนแปลงขั้นตอนหรือการเปลี่ยนแปลงกระบวนการมีผลต่อผลลัพธ์จริงๆหรือไม่ ดังนั้นเราจึงต้องการบางสิ่งที่ชี้ให้เห็นการเปลี่ยนแปลงที่มีนัยสำคัญและกระตุ้นให้เราไม่มองเพียงแต่การเปลี่ยนแปลงแบบสุ่ม สิ่งนี้ทำให้เกิด เส้นควบคุม(Control limits)
If we use the simulation to add new points on the chart all points should be between the control limit lines (although you might be unlucky and get a false signal).
ถ้าเราใช้แบบจำลองสุ่มสร้างจุดใหม่เพิ่มเข้ามาพล็อตบนแผนภูมิ จุดทั้งหมดความอยู่ระหว่างเส้นควบคุม (แม้ว่าคุณจะโชคไม่ดีและได้สัญญาณที่ผิด)
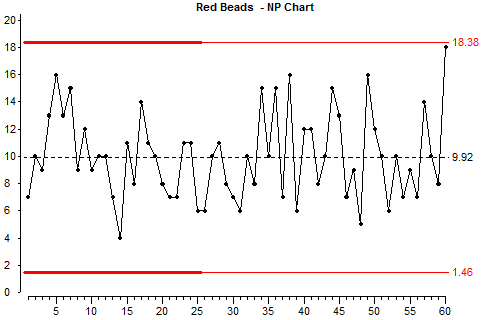
Although there are lots of ups and downs on the chart, you should be able to get an overall impression that this process is stable. There is no obvious change over the long term.ุ
แม้ว่ามีจุดขึ้นลงมากมายบนแผนภูมิ คุณควรพอใจในภาพรวมว่ากระบวนการเสถียร ไม่มีการเปลี่ยนแปลงที่ชัดเจนในระยะยาว
In this process, whatever causes the low counts also causes the high counts. The things which cause the variation are common to all the results. That is why this type of variation is called common cause variation.
ในกระบวนการนี้ อะไรก็ตามที่นับได้ที่ค่าต่ำก็จะนับได้ที่ค่าสูงเช่นกัน สิ่งที่เป็นความผันแปรที่เป็นธรรมชาติของผลลัพธ์ทั้งหมด นั่นคือทำไมถึงเรียกความผันแปรประเภทนี้ว่า ความผันแปรปกติ (common cause variation)
We also say that the results are “in statistical control”. We say this because as long as nothing changes, we can predict that this process will continue with approximately the same average, and the control limits will continue to show the maximum and minimum results that we can expect.
เรายังเรียกผลที่ได้แบบนี้ว่า “อยู่ในการควบคุมทางสถิติ ( in statistical control) เราเรียกแบบนี้เพราะว่าตราบเท่าที่ไม่มีอะไรเปลี่ยนแปลง เราสามารถคาดการณ์ได้ว่ากระบวนการนี้จะยังคงมีค่าเฉลี่ยเท่าเดิมโดยประมาณ
Now we will look at a set of results from a very different type of process:
ตอนนี้เราจะมาดูชุดของผลลัพธ์จากกระบวนการประเภทที่แตกต่างกันมาก :
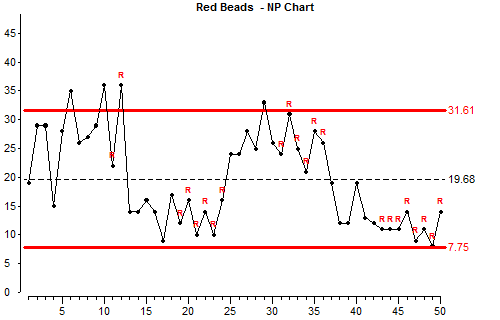
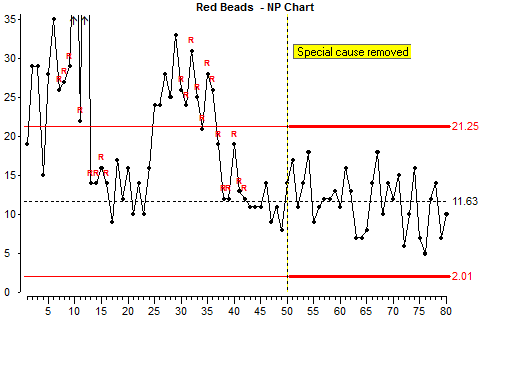
You will notice that this process has about the same average number of defects as the previous chart but the chart looks very different.
This chart is showing that the process is unstable. There are two things on the chart which indicate instability:
คุณจะสังเกตเห็นว่ากระบวนการนี้มีจำนวนข้อบกพร่องโดยเฉลี่ยเหมือนกันกับแผนภูมิก่อนหน้า แต่แผนภูมิมีลักษณะแตกต่างกันมาก แผนภูมินี้แสดงว่ากระบวนการไม่เสถียร มีสองสิ่งบนแผนภูมิที่บ่งบอกถึงความไม่เสถียร:
- some points are outside the control limit lines มีบางจุดอยู่นอกเส้นควบคุม
- some points have an “R” above them which indicates a “run”. The previous 6 points are on the same side of the average – it is unusual for random variation to produce 7 consecutive points above average or 7 consecutive points below average. มีบางจุดมีสัญลักษณ์ “R” อยู่ด้านบน บ่งชี้ว่าเกิด “รัน (run)” จุดก่อนหน้า 6 จุดอยู่ด้านเดียวกันจากค่าเฉลี่ย มันไม่ปกติสำหรับตัวแปรที่จะมี 7 จุดต่อเนื่องอยู่เหนือค่าเฉลี่ยหรือ 7 จุดต่อเนื่องอยู่ต่ำกว่าค่าเฉลี่ย
With this process, there is something else affecting it alongside the common causes of variation. Look at the results between 25 and 37 on the horizontal scale and compare them with the results between 37 and 50. Something must be causing them to be different. We call this a “special” cause of variation.
ด้วยกระบวนการนี้มีสิ่งอื่นที่ส่งผลกระทบควบคู่ไปกับความผันแปรปกติ ดูผลลัพธ์ระหว่างจุด 25 ถึง 37 ในแกนแนวนอนและเปรียบเทียบกับผลลัพธ์ระหว่าง 37 ถึง 50 ต้องมีบางอย่างที่ทำให้จุดเหล่านั้นแตกต่างออกไป เราเรียกสิ่งนี้ว่า “ความผันแปรพิเศษ (Special Cause)”
When special causes of variation are present in a process we say that the process is “unstable”. With an unstable process you cannot predict future results because we do not know when the special causes of variation will occur. If we have an unstable process, we should, whenever possible:
เมื่อมีความผันแปรพิเศษ(Special Cause) ในกระบวนการเราจึงบอกว่ากระบวนการนั้น “ไม่เสถียร” ด้วยกระบวนการที่ไม่เสถียรคุณไม่สามารถคาดเดาผลลัพธ์ในอนาคตได้เนื่องจากเราไม่ทราบว่าเมื่อใดความผันแปรพิเศษจะเกิดขึ้น ถ้าเรามีกระบวนการที่ไม่เสถียรเราควรทำสิ่งนี้ทุกครั้งที่ทำได้:
- investigate what is causing the special variation, ตรวจสอบว่าอะไรเป็นสาเหตุของความผันแปรพิเศษ
- learn whatever we can from the investigation เรียนรู้สิ่งที่เราสามารถทำได้จากการสอบสวน
- improve the process by making the best conditions permanent ปรับปรุงกระบวนการโดยทำให้ได้เงื่อนไขที่ดีที่สุดแบบถาวร
- put controls in place to prevent the special variation from returning วางการควบคุมเพื่อป้องกันไม่ให้ความผันแปรพิเศษกลับมา
In the simulation we have arranged that no more special variation will occur, so we can scoop more beads. But first we will write a note on the control chart:
ในการจำลองเราได้จัดเตรียมไว้ว่าจะไม่มีความผันแปรพิเศษเกิดขึ้นอีกดังนั้นเราจึงสามารถตักลูกปัดได้มากขึ้น แต่ก่อนอื่นเราจะจดบันทึกไว้บนแผนภูมิควบคุม
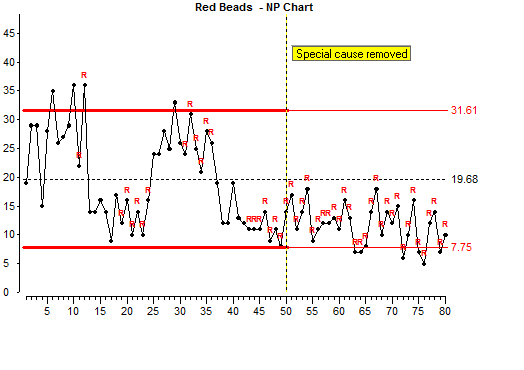
We scoop 30 more subgroups and there seems to be consistently fewer red beads now and the red beads represent something that we do not want. So there is reason to believe that we have improved this process.เราตักลูกปัดอีก 30 ครั้งและดูเหมือนว่าตอนนี้ลูกปัดสีแดงจะน้อยลงอย่างต่อเนื่องและลูกปัดสีแดงแสดงถึงบางสิ่งที่เราไม่ต้องการ ดังนั้นจึงมีเหตุผลที่จะเชื่อได้ว่าเราต้องปรับปรุงกระบวนการนี้แล้ว
We should now recalculate the control limits using results which come after the improvement.
ตอนนี้เราควรคำนวณเส้นควบคุมใหม่โดยใช้ผลลัพธ์ที่ได้หลังจากการปรับปรุง
We now have new control limits which indicate the limits of common cause variation for the new improved process.
These new limits will show if any new special causes of variation appear. If one does appear, we should investigate it and remove it.
ตอนนี้เราได้เส้นควบคุมใหม่ที่แสดงถึงเส้นควบคุมของความผันแปรปกติสำหรับกระบวนการปรับปรุงใหม่
เส้นควบคุมเหล่านี้จะแสดงถึงว่าถ้ามี ความผันแปรพิเศษปรากฎขึ้น ถ้ามีหนึ่งจุดปรากฎเราควรสอบสวนหาสาเหตุและขจัดมัน
If we want to improve a process which contains only common cause variation, we will need to investigate the factors which are constantly affecting the process and influence every result.
ถ้าเราต้องการปรับปรุงกระบวนการที่เกิดเพียงแต่ความผันแปรปกติ เราจะต้องสอบสวนหาปัจจัยที่มีผลอย่างต่อเนื่องและมีผลกับทุกๆผลลัพธ์
Lesson 1 Summary Variation and Control charts:
บทที่ 1 สรุปเรื่องความผันแปรและแผนภูมิควบคุม:
- All processes contain variation. ทุกกระบวนการมีความผันแปร
- We must distinguish between special cause variation and common cause variation. We need to know this difference because the things we will have to do to remove or reduce the two types of variation are very different. We need to reduce variation to improve processes. เราต้องแยกระหว่างความผันแปรพิเศษกับความผันแปรปกติ เราต้องรู้ถึงความแตกต่างเพราะสิ่งนี้จะเป็นสิ่งที่เราจะต้องทำการขจัดหรือลดทั้งสองประเภทความผันแปรที่มีความแตกต่างมากๆ เราต้องลดความผันแปรเพื่อปรับปรุงกระบวนการ
- The way to distinguish between common cause variation and special cause variation is to use a control chart. การแยกระหว่างความผันแปรปกติกับความผันแปรพิเศษคือใช้แผนภูมิควบคุม
- Before we can consider a process to be “under control”, efforts must be made to remove special causes of variation. We must also learn from each incident of special variation and take action to make sure that these types of changes do not happen again. ก่อนที่เราจะพิจารณาว่ากระบวนการ “อยู่ภายใต้การควบคุม” ต้องพยายามขจัดสาเหตุของความผันแปรพิเศษ นอกจากนี้เราต้องเรียนรู้จากเหตุการณ์ที่พิเศษแต่ละเหตุการณ์และดำเนินการเพื่อให้แน่ใจว่าความผันแปรประเภทนี้จะไม่เกิดขึ้นอีก
- If we want to improve a process which contains only common cause variation, we need to investigate the factors which affect every result. ถ้าเราต้องการปรับปรุงกระบวนการที่มีเพียงความผันแปรปกติ เราต้องสอบสวนปัจจัยที่ส่งผลกับทุกๆผลลัพธ์