Lesson 10 : Process capability

An important part of any SPC implementation is the use of process capability indices. There are several capability indices Cp, Cpk, Ppk, Cpm, NCpk. In this lesson we explain the most common used indices Cp, Cpk, Pp and Ppk. There is some confusion about the use of these indices. In this lesson we will try and remove some of the confusion and explain the differences between the indices and how they can be used in a practical way.

This lesson is not following the tutorial like the other lessons. The tutorial lesson is summarized in a video at the end of this lesson.

First we will provide the definitions of the indices and give some historic insight in the development of these indices which will explain some of the confusion. Then we will explain how the indices can be used in a practical way.

History
What is important to know before we will explain the definitions of the indices is that the definitions in the past have changed.
Ppk was defined under the Q101 system of Ford as the preliminary capability index and the Cpk was defined as the long term capability index.
In some cases the Cpk value on the histogram was calculated differently from the Cpk calculations on the control chart. When the big three (Ford, GM and Chrysler) merged their quality manuals into the QS9000 system the definitions where changed and these definitions are still the standard nowadays in the TS16949 manual and will be used and explained in this lesson.

Definitions
Cp:
Cp (sometimes also named Cpi) stands for the capability index of the process. The formula for the calculation is:

statistical-process-control-l10-Cp
The formula refers to the estimated standard deviation. The estimated standard deviation is calculated using the following formula:

statistical-process-control-l10-sigmahat
where R bar is the average range of subgroups and d2 is taken from a statistical table.

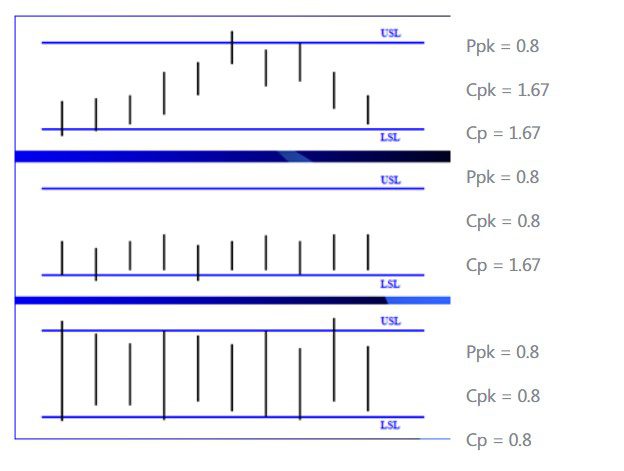
In normal words it means the Cp index is calculated based on the within subgroup variation. So if the variation within the subgroup is very small you will have a good Cp index no matter how much the process average is drifting or what the location of the process is so the Cp index shows you how capable your machine is to produce consecutive products within the required variation (Tolerance).

Cpk:
Because the Cp index alone doesn’t indicate if you are producing within specifications we need an indication of the process is centered between the specification limits. Therefore the Cpk index is used. The formula is:

statistical-process-control-l10-Cpk
So if the process is exactly in the middle of LSL and USL the Cp and Cpk index are the same.

If we now report both Cp and Cpk index we know how capable the process is to produce within the required variation (tolerance) and if the process is producing in the middle of the tolerance.

Pp:
Is the information about Cp and Cpk enough to indicate if the process is running within specifications?
The answer is no because these 2 indices are calculated based on the within subgroup variation and it is still possible there is a large amount of between subgroup variation which is not taken into account.
Let us try to explain this with an example:

The chart shows we had a lot of variation between subgroups (Xbar chart) but the variation with the subgroup was much better in control (Range chart).

The Cp index for this process is 1.66 and the Cpk index for this process is 1.65 which indicate the process is capable to produce within the required variation and over the reported time period this process is in the middle of the tolerance.
We see that these 2 indices are not enough and we need more information to know if the process is producing within specification limits. If we only use Cp and Cpk we need to add the requirement that the process must be in control. If the average chart is in control it indicates the process is stable and the process average is not fluctuating.
However we don’t always have the chart available when analyzing process data for example if we report a large number of characteristics. In that case we could indicate the percentage of subgroups out of control but there is also another possibility.

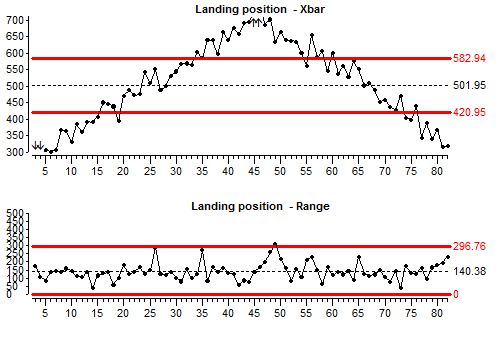
We can also know if the process is stable by calculating the Process Performance Index Pp.

The Pp index is calculated in the same way as the Cp index but now using the real standard deviation instead of the estimated standard deviation. So the formula is:

statistical-process-control-l10-Ppk
So the Pp index uses both within subgroup variation and between subgroup variation in the calculation and indicates how well the process was capable to produce within specification limits over the reported time period.

The Ppk index is calculated in a similar way as the Cpk index and needs no further explanation.

Practical use of Capability indices
If we now report 3 indices eg Cp, Cpk and Ppk we know what is happening in the process:
– Cp indicates how well a process is capable to produce consecutive products within the required variation;
– The difference between Cp and Cpk indicates if the process is producing in the middle of the tolerance.
– The difference between Cpk and Ppk indicates if the process is stable or in other words if there are special causes of variation which are influencing the average of the process even if control limits are not properly set.

The requirement in industry is that the Ppk value should exceed 1.67.

If the Ppk value is below 1.67 the combination of Cp, Cpk and Ppk will give you an indication who is responsible to improve the capability. Let us explain with an example:

All 3 processes have the same Ppk index of 0.8 but require a completely different approach to improve capability and likely also a different department will be responsible to improve the capability.

Process 1: Unstable, Long term not capable, Short term capable, On target.
This process is out of control and has assignable causes. There is more between subgroup variation than within subgroup variation.

Process 2: Stable, Short term capable, Long term capable, Not on target.
This process has a wrong process setting and if the process is brought on target the Ppk will be acceptable.

Process 3: Stable, Short term not capable, Long term not capable, On target.
This process is not capable to produce consecutive products within the allowed tolerance so this process needs to be altered.

There is also a tutorial for this lesson but because interactivity is required we have a recording of this sessions

Please view: process capability video training

For a training about process capability indices click on: training

End of lesson 10

This training examples are all made using SPC Wizard.
For more information about DataLyzer SPC software or SPC Wizard contact us or ask for a free demo via the contact page on our website.
Feel free to use and copy all information on this website under the condition your refer to this website. If you like what you see please link to this site and refer the site to others.